Battle of Buffalo Neighborhoods — A Data Science Capstone Project
Battle of Buffalo Neighborhoods
Introduction
In this project, I will be exploring the neighborhoods in Buffalo, NY. Buffalo is the 2nd most populous city in the state of New York. It has recently been a major destination for many immigrants. I will try to see which neighborhood would be a good area for a business that is owned by an immigrant business person who is currently running a business in Brooklyn, NY.
This entrepreneur is considering moving his business to another city due to the high costs in Brooklyn, NY. Buffalo is the first option among the possible cities for this person along with Syracuse and Albany.
Data
I will be using data obtained from https://data.buffalony.gov/ . The data set I chose is called “Neighborhood Metrics”. The link to the dataset is https://data.buffalony.gov/Economic-Neighborhood-Development/Neighborhood-Metrics/adai-75jt/data
This dataset is compiled by the Buffalo Urban Renewal Agency (BURA) from the 2017 American Community Survey (ACS), the premier source for detailed population and housing information about the nation. The ACS is an ongoing survey that provides vital information on a yearly basis about the nation and its people. More information on the survey is available at https://www.census.gov/programs-surveys/acs/data.html
Another dataset I will/might be using in this project is called the 311 Service Requests dataset. This is a dataset of 311 service requests for the City of Buffalo from July 2008 — present. 311 is a toll-free number reserved nationwide since 1997 for non-emergency calls to police and other government offices. The dataset is also available at https://data.buffalony.gov/Quality-of-Life/311-Service-Requests/whkc-e5vr/data
I will also use the Foursquare location data for the neighborhoods I will be exploring. The datasets mentioned above already have the longitude and latitude data. Using those geolocation data, I will explore the venues within those neighborhoods as well as the service calls received from those neighborhoods to arrive at a better-informed decision.
Methodology
I will first explore the neighborhoods on a map using the location data (latitudes and longitudes). I will use folium package for that. Folium offers great map visualizations for geographical data.
Once I have the neighborhoods displayed on a map, I will then use the location data again to pull out the businesses data in those neighborhoods using the Foursquare data through an API.
Foursquare is a technology company that built a massive dataset of location data. They smartly crowd-sourced their dataset through people using their mobile app and adding venues, which gradually turned into a one of the most comprehensive location dataset that feeds many popular services like Apple Maps, Uber, Snapchat, Twitter and many others.
Finally, I will have a look at the service calls dataset to see what type of service calls were made from that neighborhood for a better-informed choice.
Results and Discussions.
A quick overview of the “Buffalo Neighborhood Metrics” dataset shows that there are 35 neighborhoods in Buffalo area and the latitude and longitude data for those neighborhoods are readily available in the same dataset.
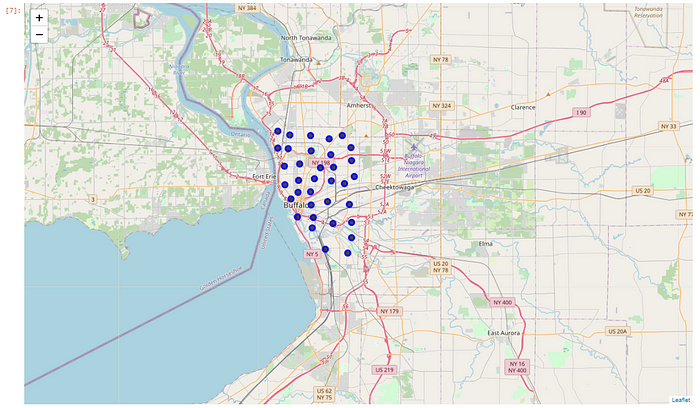
First we obtained the geographical coordinates of Buffalo using Nominatim library by geopy. Once we had the latitude and longitude values of Buffalo, we then created a Buffalo map using the Folium library, then we superimposed the neighborhoods on the Buffalo map as markers using their location data through a for loop.
This is what we got:

Then we moved on to exploring the business venues in those neigborhoods. Foursquare date came in very handy at this step. Using the geographical coordinates data we had, we created a function called “getNearbyVenues”, which iterated over all the 35 neighborhoods and pulled out the list of venues within a radius of 500 meters of each neighborhood center using the API. The API request also pulled the geographical coordinates and the venue category (restaurant, hockey arena etc.) of each venue pulled. Once we had that data, we converted it into a table (a data frame so to speak) and this is what it looked like:

After this, we had a quick overview of the counts of each unique category across all districts. Here is how it looked like:

When we analyze the neighborhoods , we saw that the most common 10 venue categories in each neighborhood were using onehot coding (dummies) and looking at the frequency of occurrence of each venue category. This is how it looked:

For the most part, coffee shops and eateries were the most common venues in the neighborhoods and a variety of categories as the second most common venues.
Conclusion
We see that the West Side the most common venue category is Vietnamese restaurants. This means that there might be a big Vietnamese as well as other Asian communities in and around that neighborhood.
As the entrepreneur is of Asian origin, a neighborhood with Asian communities would be a good place to consider starting businesses as this translates into a better customer potential for the services and products his business has to offer.
The service calls analysis showed that the neighborhood is not one with much issues, too. Out of 52033 total calls from all 35 neighborhoods, West Side had only 8 calls and two of them were to do with parking issues, two with police issues and five with pot hole issues. Therefore, it can be a good neighborhood to start with his business ventures.
All Neighborhoods Calls

West Side Calls
